Scaling from Zero to Millions of Custom Code Executions per Day
How Team Iris built and scaled the Managed Code Execution service at SAP LeanIX, from the very first Deno-based execution to handling millions of daily requests through process pools, caching, and buffered writes.
When I joined Team Iris in November of 2024, the team was in an early discovery phase for a new service, which would soon be named "Managed Code Execution". The idea behind this service is to provide a unified custom code environment for all existing and upcoming features in the LeanIX product. Before we dive into the technical details on how we implemented this service and our later efforts to scale up to the increasing demand, let's first look at the features we support with this functionality:
- Calculations: Calculations was set to be the first active customer for the Managed Code Execution service. Starting development only shortly after our service, it is aimed at allowing users to define dynamically calculated fact sheet fields. These fields can depend on other fact sheet or relation fields and when those are updated, the calculated field is updated as well.
- Webhooks Callbacks: As one of the older microservices at SAP LeanIX, this feature allows a user to modify the exact shape of outgoing webhook requests before they are actually sent. To achieve this, the Webhooks service embedded the JVM-based Nashorn JavaScript execution engine. Among other disadvantages, this engine does not keep up with newer JavaScript language features, so we migrated that service over to use the new Managed Code Execution service.
- AI Inventory Search: This feature in the inventory allows users to describe the desired filter criteria in natural language. A Joule-powered LLM will generate a piece of code to configure the existing filter options to that output.
- Automations: The latest addition to the supported services is Automations. As part of automation workflows, users can now define custom script actions that can even perform network requests to the LeanIX APIs!
With all these services and features pushing for increased adoption, the number of execution requests to the new service has only increased over the last year. To keep up with demand, we have spent quite some effort in making sure the requests are served quickly while at the same time keeping high security standards in place. With all of this in mind, let's dive into the technical details from the very beginning.
The Very First Code Execution
The implementation of the service got kicked off in December 2024, and to get moving fast, the team decided on a very straightforward approach. We would rely heavily on the modern and feature-rich Deno JavaScript runtime to build the code execution capability. It was built by the original creator of Node, as a modern alternative that incorporates all the learnings from Node. Deno provides a strong security model out of the box, which is a perfect fit for executing untrusted code. Like Node, Deno relies on the v8 JavaScript engine of the Chromium project. Unlike Node it is written in Rust, with the maintainers putting a lot of emphasis on it's performance and safety.
The CRUD operations for storing and managing customers' scripts were quickly put in place, built using Spring+Kotlin. Then began the more interesting part of building the service: we were ready to actually run some code, for which we had to implement the POST /execute endpoint. Simplifying a bit, these are the required steps in processing:
- Load the to-be-executed code from the database
- Prepare all data that should be available to the script
- Run the script and collect output
- Store the execution result in the execution log
- Store telemetry data in the outbox
- Return a response
Let's have a closer look at Step 5, as this outbox will be important later: We use the outbox pattern to defer transmitting metadata of the execution to our logging infrastructure. Instead of sending this data to the logging component synchronously with each execution request, it is written to a special outbox table in our database, from which it will be read and then sent at a later time. This is a common pattern and has been used across different services at SAP LeanIX. With that context in mind, let's look at how the execution itself was implemented.
To actually run the code in this first iteration, the runner module as we call it, would write both script and data to disk. The script was thinly wrapped with some additional JavaScript to meet the interface we had defined for the customer code. Then a Deno process was started by calling deno run on the script, with the appropriate arguments and security flags. The JavaScript wrapper made sure to collect the output and print it to stdout for the caller to read and return in the response.
This approach worked well and allowed us to move fast, but we soon hit a wall in regards to performance.
First Scaling Challenges
By March 2025, as adoption of the new service grew more and more, we started seeing latency spikes under load hitting unacceptable 30 seconds, with some requests failing altogether. Without load, execution latency was around an acceptable 200ms, but we knew that we had to improve the situation.
We traced back the issue to Hikari connection pool exhaustion under load. The Deno code execution was taking a comparatively long time between loading the code from the database and writing the result back, during which the connection was held in the thread. This meant the connection pool exhaustion was just a symptom of slow code execution. Making the execution faster would allow the threads to return connections more quickly, resolving our performance problem.
We also experimented with configuring Spring Boot to use virtual threads, but that did not lead to meaningful results. After more investigations, we came to the conclusion a different and smarter model for actually running the code was needed. Starting a new Deno process for each request was simply resulting in a lot of unnecessary overhead.
The Process Pool Revolution
In April 2025, this insight led us to investigate how we could keep Deno processes alive to serve multiple requests, especially during load bursts. We often saw usage patterns with large bursts for a single piece of code. This made it seem like keeping processes alive was an ideal fit for the situation.
We completely rebuilt the part of the runner module responsible for delegating work to Deno. Now each piece of code was assigned a single, long-lived process instead of a new process per request. This turned the thin JavaScript wrapper from before into a full background service process. This process continuously reads from stdin for any input from the Kotlin application. The input includes both code and context data, which the Deno process then executes. The result gets written back to stdout for the Kotlin application to read.
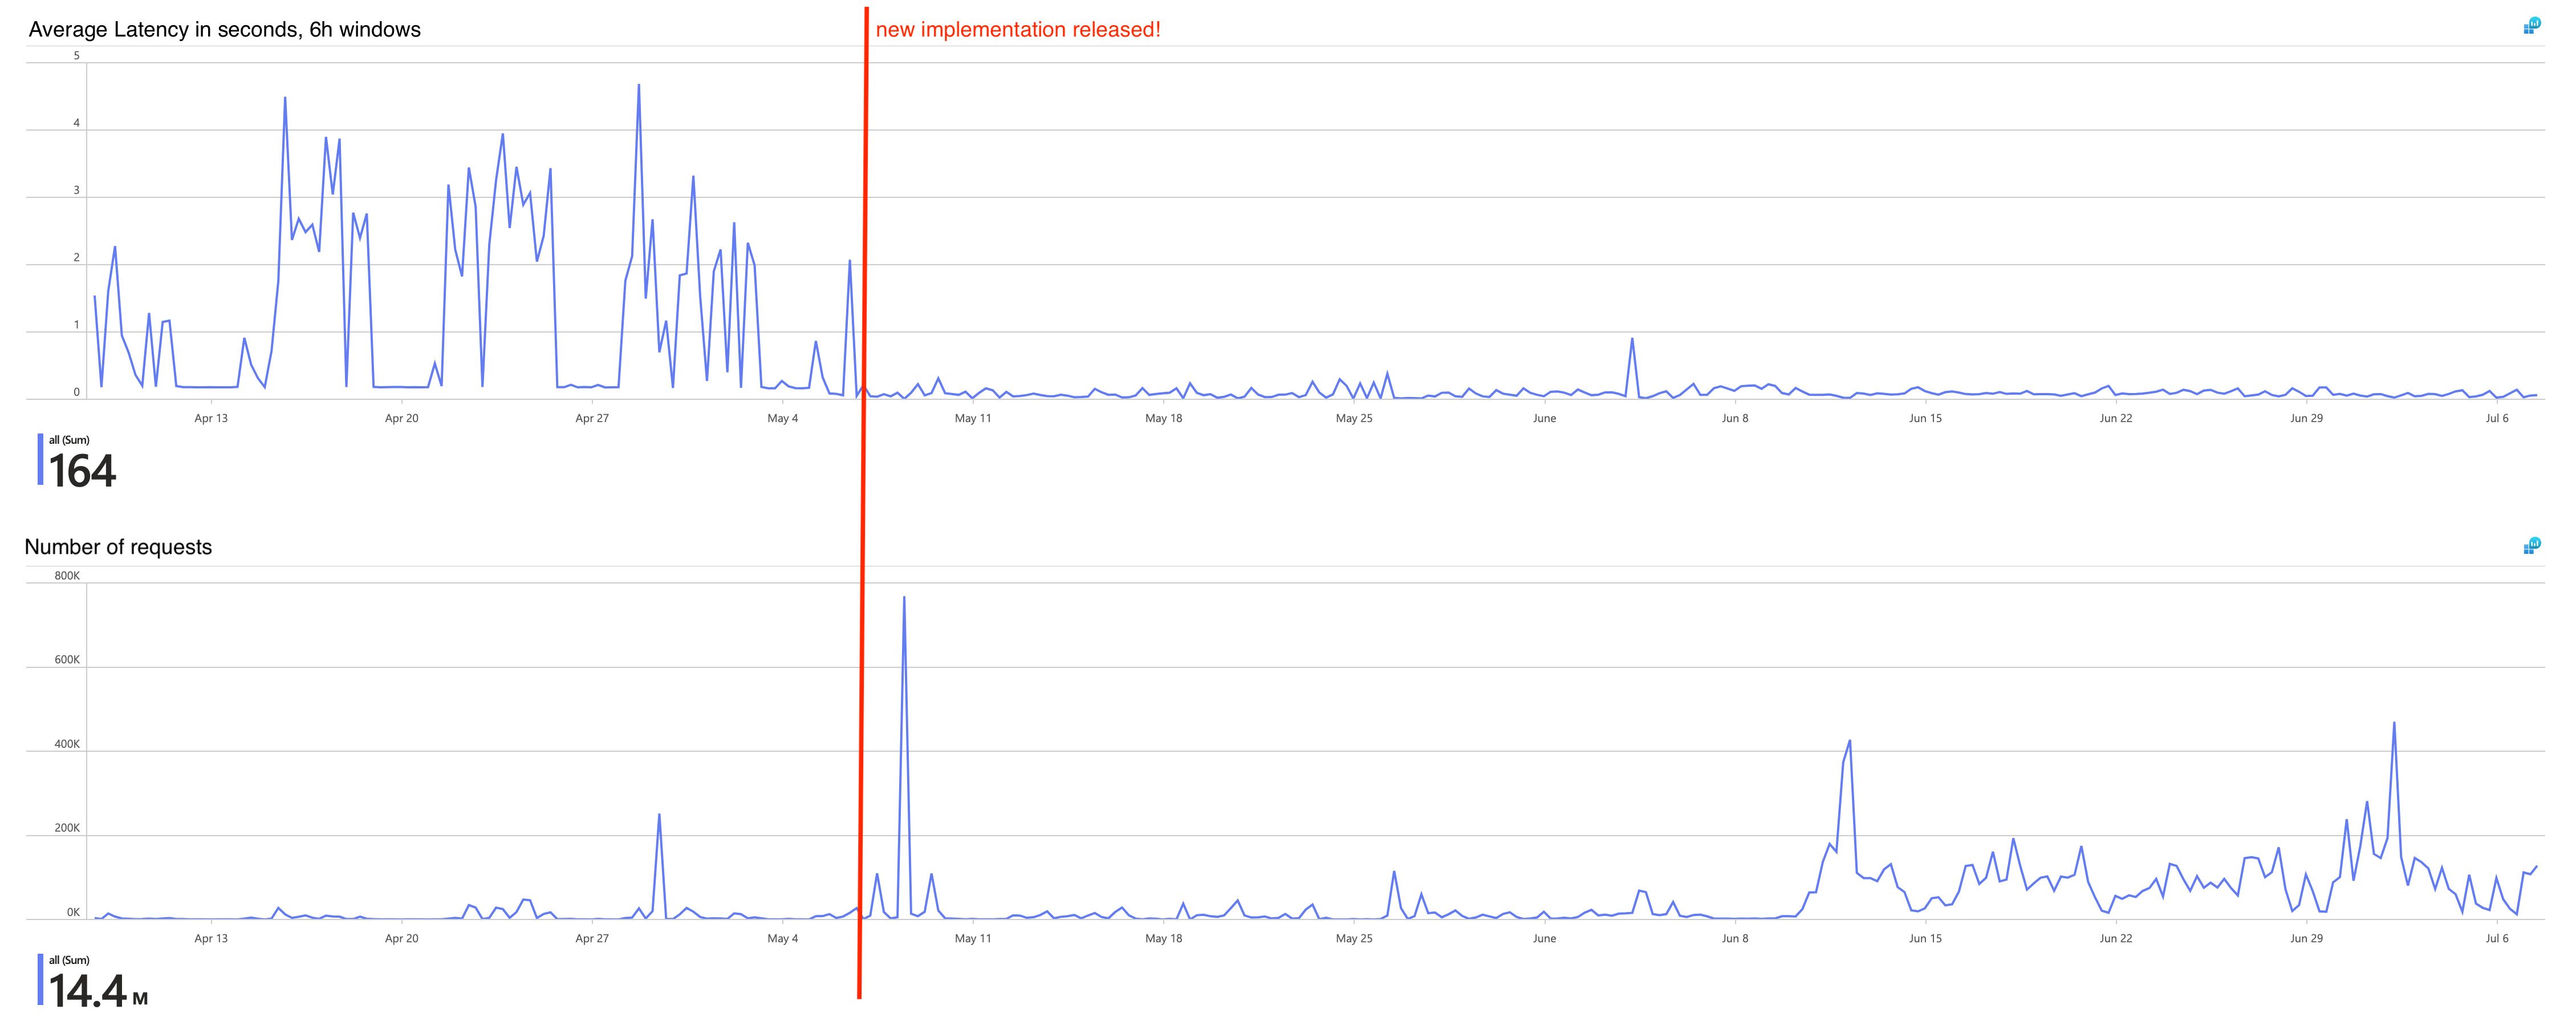
This refactor led to a surprisingly nice performance jump, decreasing latencies while the traffic grew further. Interestingly, our metrics still clearly show the benefits we get from keeping the processes alive. When a burst for a single execution configuration hits the service, latency drops below average.
Code Caching
In July 2025, we thought to have identified our next bottleneck in database operations. Over the course of an execution, there are three distinct queries which need to be run:
- Fetch the code to execute
- Write the execution log
- Write additional telemetry into a separate table (outbox)
That means on each request, there is a single query reading from the database, followed by two queries inserting results and metadata after execution. As a quick and simple improvement, we decided to cache initial read query for a short period of time. That already somewhat helped, as it reduces the amount of database connection acquisitions for an execution, but it was not as big of a difference as we had hoped. To understand where the real pressure was coming from, we needed better visibility into the system — which became the focus of the next phase.
OpenTelemetry All the Way
With the service gaining popularity, we quickly realized not everything was transparent. Around September 2025, as the transition to OpenTelemetry was getting started, we saw this as an opportunity to improve observability. OpenTelemetry is an open standard that defines the shape of various types of data in the observability domain. Most relevant for us in this case were OpenTelemetry traces and metrics. Given the task to migrate to OpenTelemetry, we took this as an opportunity to not just migrate, but also improve our observability setup for the Managed Code Execution service.
As Deno itself had just released support for OpenTelemetry, we jumped on the opportunity to connect traces from Deno with the traces from our Spring Boot/Kotlin application. Finally, this allowed us to bring together high-quality data like logs, traces, as well as metrics, all unified in our Grafana instance. This visibility throughout the whole stack greatly helped us see into the real-world performance of the service and tackle the final performance bottleneck.
Buffered Logs Breakthrough
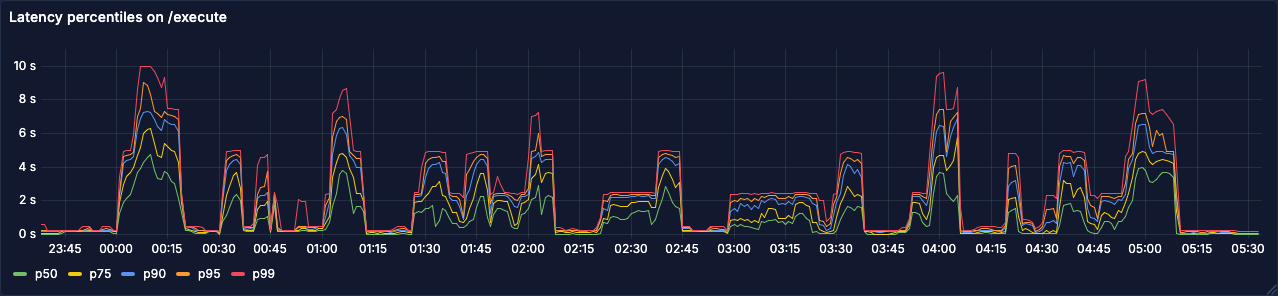
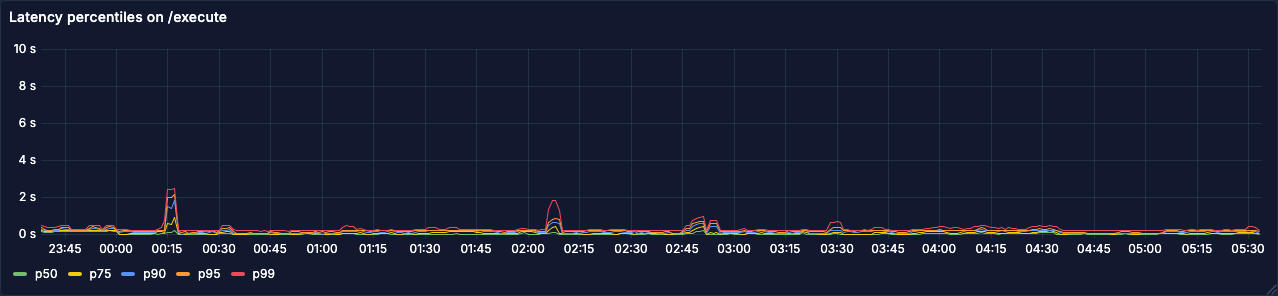
By January 2026, with ever growing demand on the service and bottlenecks that had not been addressed or even fully narrowed down yet, it was time to finally find a solution. During nightly load spikes, latencies on the execution endpoint still regularly reached into multiple seconds.
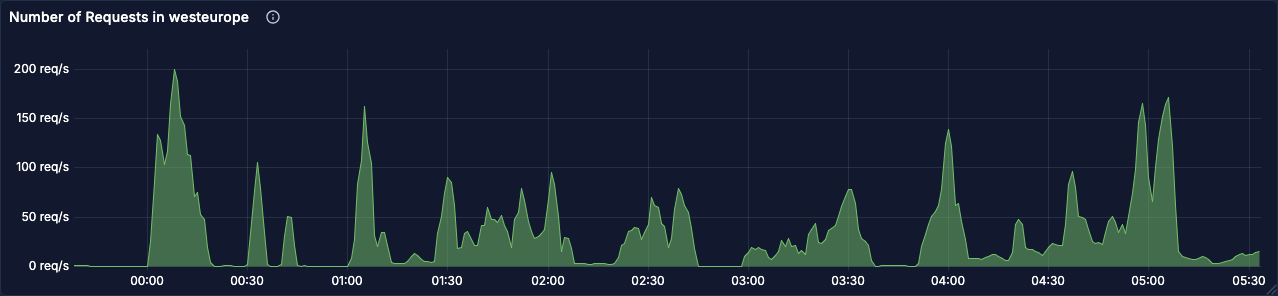
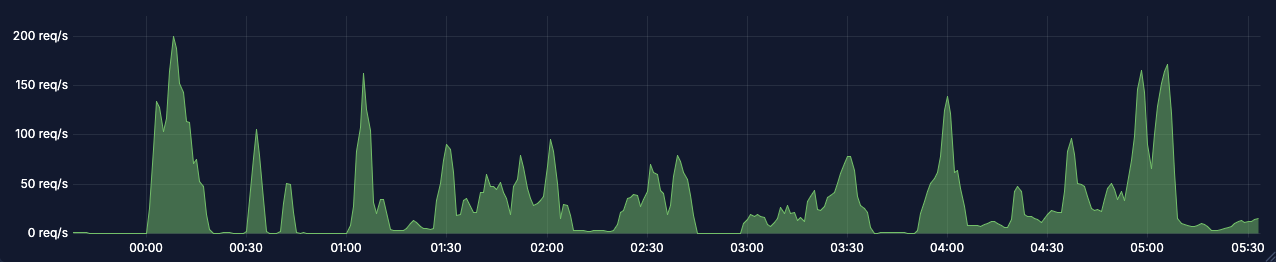
Let's have a look at some charts from Jan 7th, a few days before we rolled out the optimization that fixed all of this:
With our new and improved observability tooling, we decided to look at the span metrics for the relevant database queries in Grafana. The following graph shows latencies for the queries #2 and #3 from above. Interestingly, inserts into the execution logs table during load spikes is two latency buckets above inserts into the outbox table.
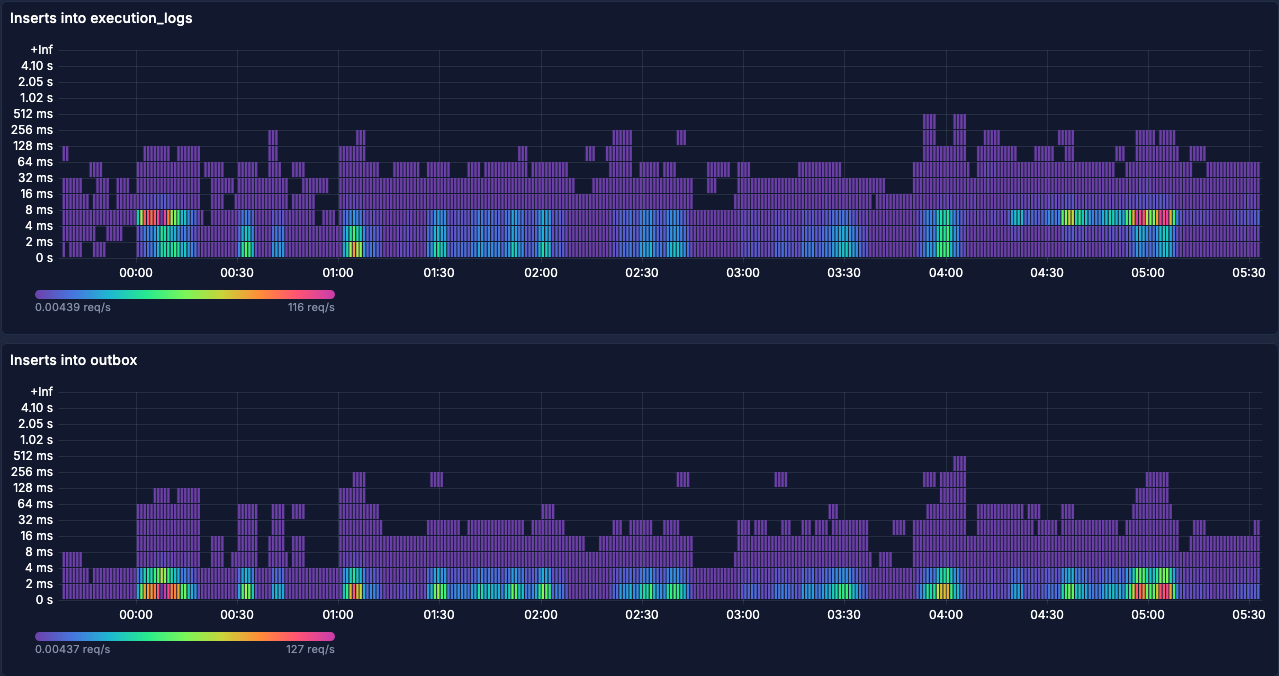
We concluded this would probably be due to index operations on the logs table, as the outbox table has a much simpler setup with respect to indices. These insert queries seemed like the next candidate to optimize. However, the latencies on the actual inserts cannot explain the much higher latencies on the overall request. For this, we also looked at connection acquisition:
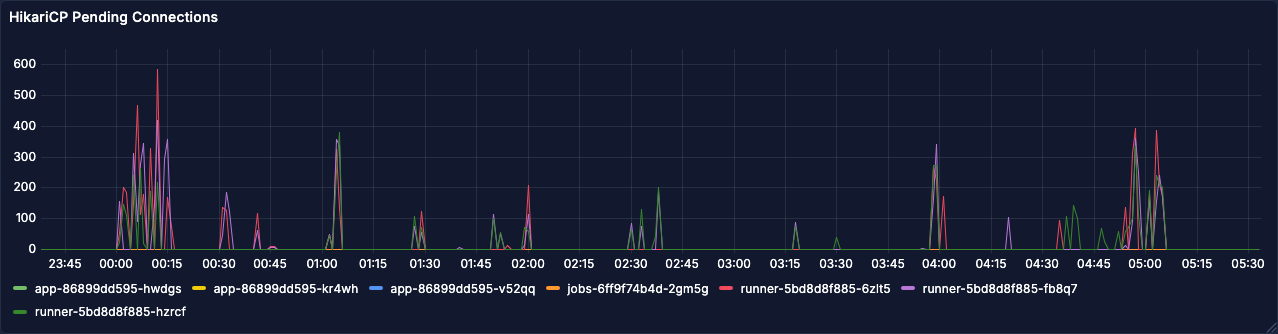
These requests waiting for a connection can explain the higher latencies seen above. With a fixed number of connections available in the pool, some requests are waiting for others to finish processing. The comparatively slow inserts on the execution log might explain why connections are not released as fast as they should be. The question now was, how can we improve the situation?
As an experiment to improve the performance, a buffer table nearly identical to the execution log table was created. The only omission for this buffer table are the indices, as the high write pressure meant constant index recalculations. A background job would then asynchronously pick up these buffered entries and batch insert them into the original table, leading to way fewer operations on the indices. In a way, this buffer table plays a similar role to the outbox table: data lands there first, then gets moved by a background process. The key difference is that the outbox moves data out of the service to external infrastructure, while the buffer table simply moves data sideways within the same database for performance reasons.
As an additional optimization, we also modified how the entries to the outbox are written. Instead of having two insert queries per execution request, we also write this data into the buffer table. The background job is then responsible for transferring this data to both, the actual execution log table as well as the outbox table.
With all this in mind, let's look at the same charts from after the change (Feb 4th):
While the load is similar, the latencies have improved drastically. At the same time, the pending connections chart is completely flat at zero, indicating this is no longer a problem. By buffering the execution log inserts in that new table and batch inserting them back into the original table, we were able to fix the bottleneck!
This has the downside of execution logs not being available immediately after the execution response returned, but we were willing to make that tradeoff. Under normal conditions, the delay is just a few milliseconds, so this was an easy decision.
Looking Back
Over the course of the last year, the Managed Code Execution service went from struggling to execute a few hundred requests to millions of code executions per day, regularly hitting 400 requests per second during higher load spikes. This was only possible through a series of optimizations, each targeting a specific bottleneck we identified through our observability stack:
- Process pools eliminated the overhead of spawning a new process per request
- Code caching reduced repetitive database reads
- OpenTelemetry integration gave us the cross-stack visibility to pinpoint where time was actually spent
- Buffered log writes removed index contention as the final bottleneck standing in our way
We are still very happy with our choice of using Deno as an underlying technology, as it has taken a lot of the security concerns off our plate while still providing great performance. Even though it occasionally might have seemed different to us at the time, Deno was never the actual bottleneck in our system. The optimizations we implemented were all around the Kotlin/Spring Boot application orchestrating the code execution. This goes to show how important it is to have good observability in place.
Through the iterative approach of observing behavior, implementing a fix and then observing the results again, we were able to keep up with the growing demand on the service. The service is now a critical part of multiple features in the LeanIX product and we are excited to see how it will evolve in the future.
Published by...

Jona Löffler
Visit author page