Reacting to security alerts
A walkthrough how we reacted to a security alert and how we handled it.
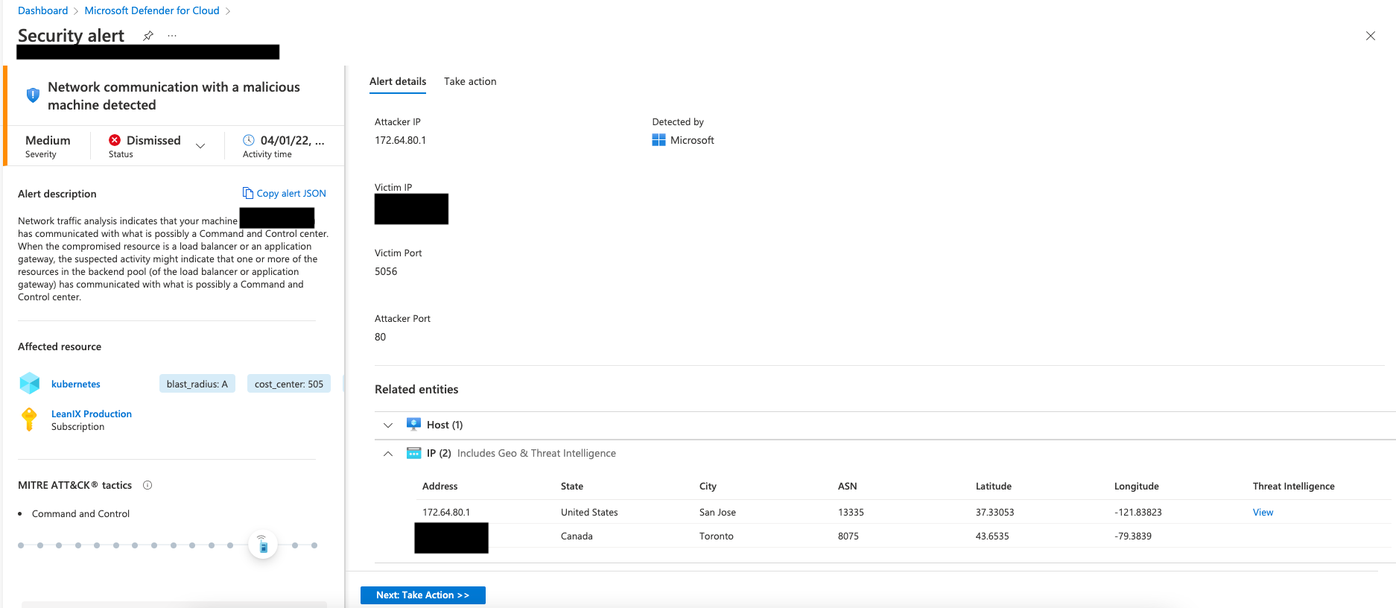
On April 1st, 2022, we got a security alert by Microsoft Defender for Cloud indicating that outbound traffic to a malicious IP address has happened on one of our Azure Kubernetes Service clusters in the Canada Central region in Azure.
Network communication with a malicious machine detected
Network traffic analysis indicates that your machine (IP %{Victim IP}) has communicated with what is possibly a Command and Control center. When the compromised resource is a load balancer or an application gateway, the suspected activity might indicate that one or more of the resources in the backend pool (of the load balancer or application gateway) has communicated with what is possibly a Command and Control center.
https://docs.microsoft.com/en-us/azure/defender-for-cloud/alerts-reference#alerts-azurenetlayer
So, how do we react to such alerts within LeanIX?
Primarily, such security alerts are flowing into a dedicated Slack channel which is monitored by the Information Security and the Platform Operations team.
Immediately after the security alert arrived, we as the Platform Operations team informed our Information Security team in LeanIX with the details provided by Microsoft Defender for Cloud to align on the next steps to mitigate the security alert.
This resulted, as you would expect in such a scenario, in adjusting our security systems configuration to block outbound traffic to the specific IP address 172.64.80.1 on all our Azure Kubernetes Service clusters.
On the affected Azure Kubernetes Service cluster, we initiated as a next step a rotation of all pods, kubectl rollout restart deployment, to disconnect potential connections to a C&C server and remove persistence in affected pods.
After the initial mitigation step comes the challenging part: identifying the root cause. The first look into our logs did not show any kind of information related to the security alert. Hence, in alignment with Information Security, we fine-tuned our outbound connection logging on our Istio sidecar proxies and security systems.
Further log queries and observations showed us that only the Azure Kubernetes Service cluster in the Canada Central region was affected and not our other regions.
Digging deeper into our log data showed us as well that none of our LeanIX microservices initiate the outbound connections. So, we concluded with the Information Security team that our microservices are not the root cause and it must be one of the system services we use for a variety of functions within the cluster like logging, monitoring, application scaling, or applying policies.
One downside of the fact that it must be a system service is that we cannot get the pod’s IP address out of the logs of the security system as outbound traffic initiated by pods to external addresses have the node’s IP attached to the log information as source IP and not the pod IP itself. Furthermore, under normal conditions system services do not have an Istio sidecar proxy injected, and therefore the outbound traffic logging from the Istio sidecar proxy is missing here as well.
At least with the nodes' IP addresses, we reduced the investigation scope even further as the IP 172.64.80.1 was contacted during the node's intialization phase when a cluster autoscaler event happened to add a new node to the node pool.
Using the Kubernetes CVE 2020-8554 to identify the root cause
With the information above that the outbound traffic happens during the node’s initialization phase, we had the certainty that it was not a LeanIX microservice that initiates the outbound connection. Only system services deployed as a daemon set are already started during the initialization phase which reduced the investigation scope even further.
So, how can we get that last piece of the puzzle identifying the root cause? Per design in Kubernetes, Kubernetes allows setting external IPs for a Kubernetes service object with the type ClusterIP which leads to the behavior forwarding all traffic that targets this external IP to the pod behind the service object instead.
This behavior per design has been raised as a CVE 2020-8554 and allows a man-in-the-middle attack.
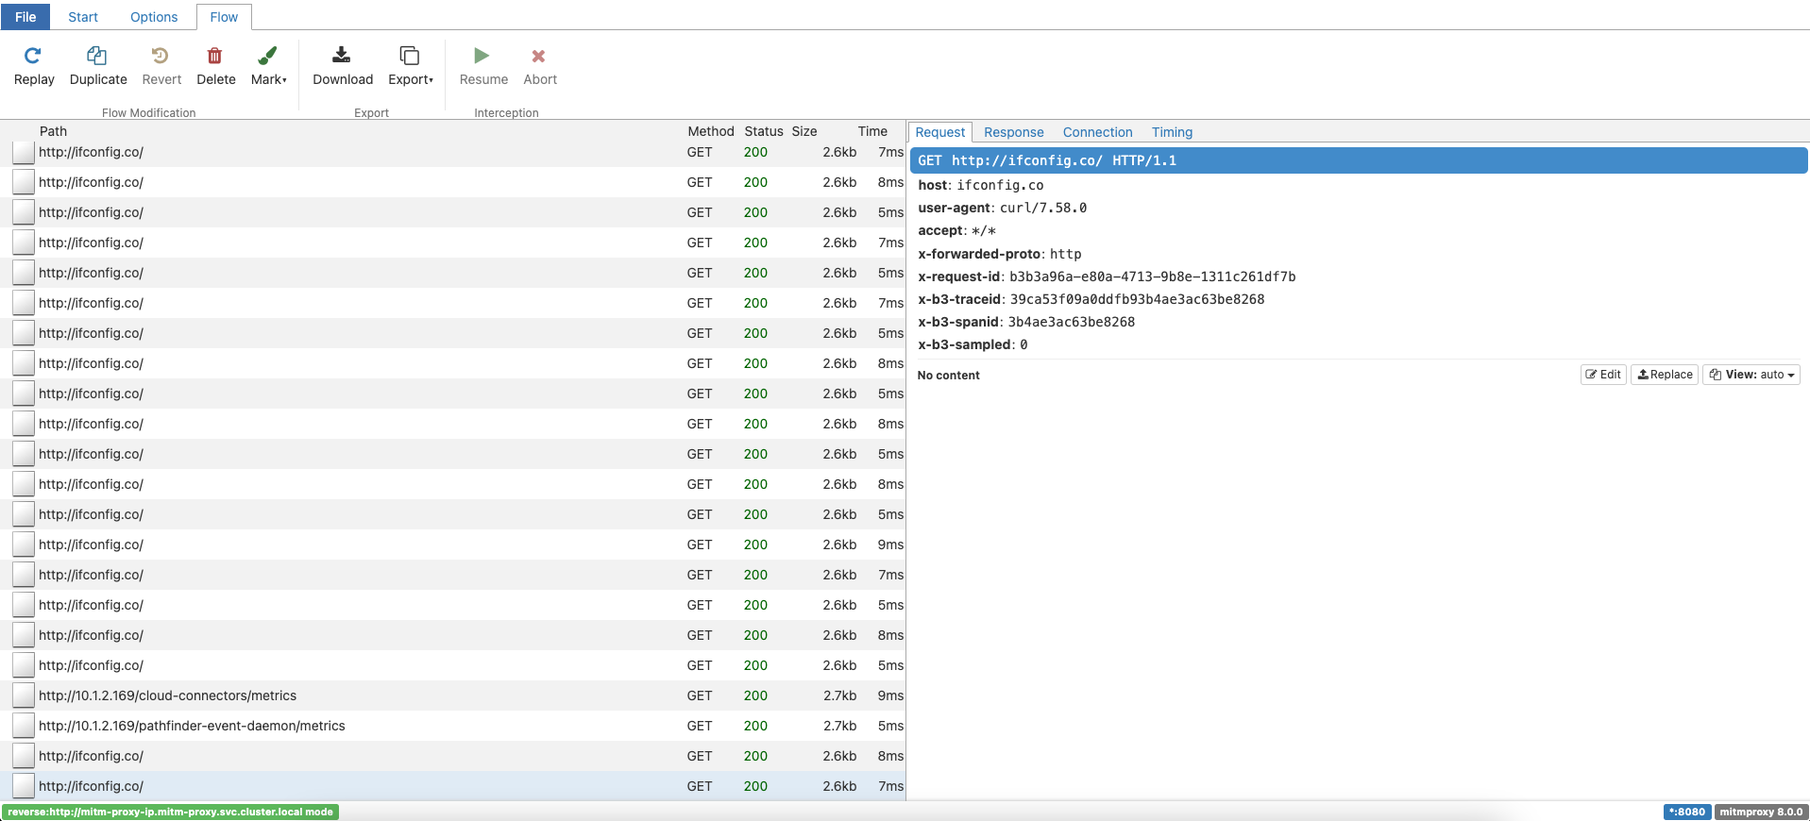
Again, we aligned with Information Security to implement a time-limited exception in our Gatekeeper policy which normally prevents setting an external IP for a service object in our Azure Kubernetes Service clusters. This time-limited exception allowed us to deploy the mitmproxy with the necessary configuration to intercept the traffic targeting the IP 172.64.80.1.
Now, we had to wait for the next cluster autoscaler event to happen.
The root cause
Strike, during the first cluster autoscaler event, we had the last piece of the puzzle. The Azure Monitor for containers agent oms-agent initiates an outbound connection to ifconfig.co. The DNS query of ifconfig.co using the Azure-provided name resolution in the Canada Central region returns the IP address 172.64.80.1.
What a relief that our Azure Kubernetes Service cluster in Canada Central has not been compromised. But this finding raised further questions:
- Why does the Azure Monitor for containers agent reach out to
ifconfig.co? - Is
172.64.80.1the correct IP forifconfig.co? Running a DNS query on our local clients against the Google and Cloudflare DNS servers returned a different result. - Why did we get a security alert for this by Microsoft Defender for Cloud?
Before we raised an Azure support ticket, we decided to gather more information about why the Azure Monitor for containers agent reaches out to ifconfig.co.
As the source code of the Azure Monitor for containers agent is publicly available on GitHub, we looked first into the source code.
We found the command in question which is a simple curl against the URL ifconfig.co.
The agent only does this if the connection check against the Log Analytics workspace address fails before. Which explains the behavior we have observed that we do not get outbound traffic to this IP every time a node starts up.
ifconfig.co is a service that simply returns the public IP address, and such services are commonly used for checking outbound connectivity.
Reaching out to Azure Support
After having all the information with its details, we opened a support ticket with Azure Support to get an answer to the following two questions:
- Does the Azure-provided name resolution return the correct IP when resolving the FQDN
ifconfig.coin the Canada Central region? - Why did we get a security alert for this by Microsoft Defender for Cloud?
During their own deep and thorough investigation for over a month, Azure Support involved several different teams within Microsoft and eventually provided us with the answers.
- The name resolution in Canada Central is working as intended. Hence, the IP
172.64.80.1which is returned for doing a DNS query onifconfig.cois the correct one. - Based on how Microsoft Defender for Cloud works, its ML models/algorithms, threat intelligence databases, and entries in public IP abuse databases like AbuseIPDB we got an alert for this outbound traffic.
Summary, learnings, and improvements
Eventually, we had all the information concluding that this was not malicious outbound communication with a C&C server. The alert has shown us that it is key to have fast mitigation of such a security alert, getting enough time to do a deep and thorough analysis without making early and false assumptions of what might have been the root cause.
Besides that, close monitoring throughout the investigation phase is required as other security alerts might appear which are related to the current one under investigation. Which again requires fast mitigation, buying enough time to continue with a deep and thorough analysis.
The learnings and improvements we pulled out from this security alert are the following:
- Constant communication is key to success. Even small steps towards the root cause shall be immediately shared between everyone participating in the investigation.
- One cannot have enough log data. We improved our log data set as at the beginning of our investigation we found out that the current log data could be expanded to contain more aspects that could aid the investigation.
- Clear guidance on what are the next steps. Together with Information Security, we developed security playbooks enabling every engineer in LeanIX especially on-call engineers, and the engineers of the Platform Operations team to mitigate and investigate such security alerts.

Published by Daniel Neumann
Visit author page